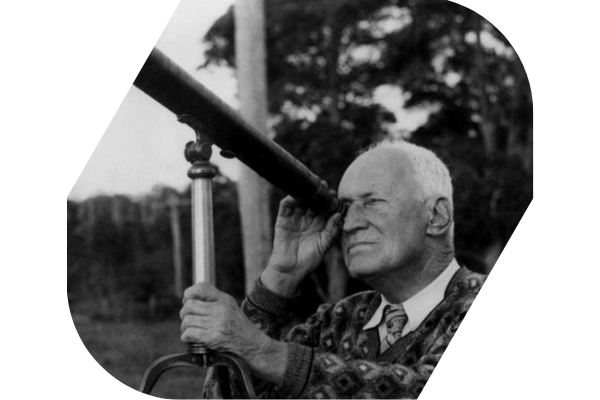
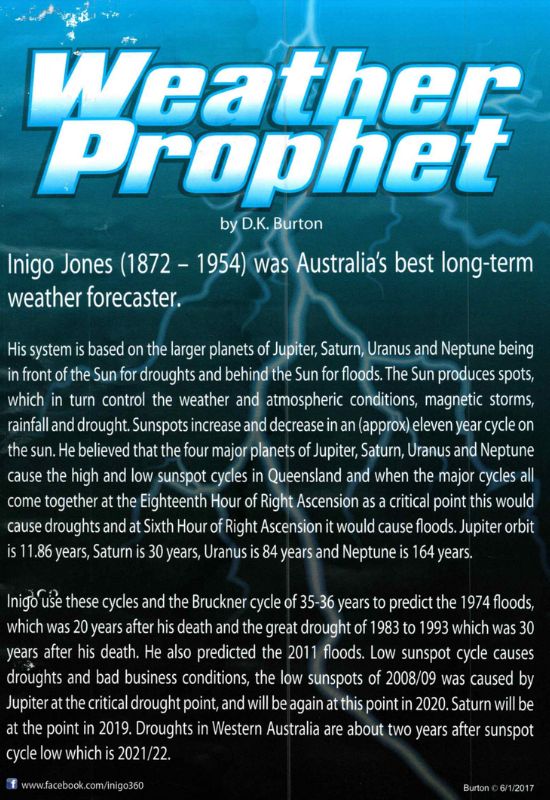
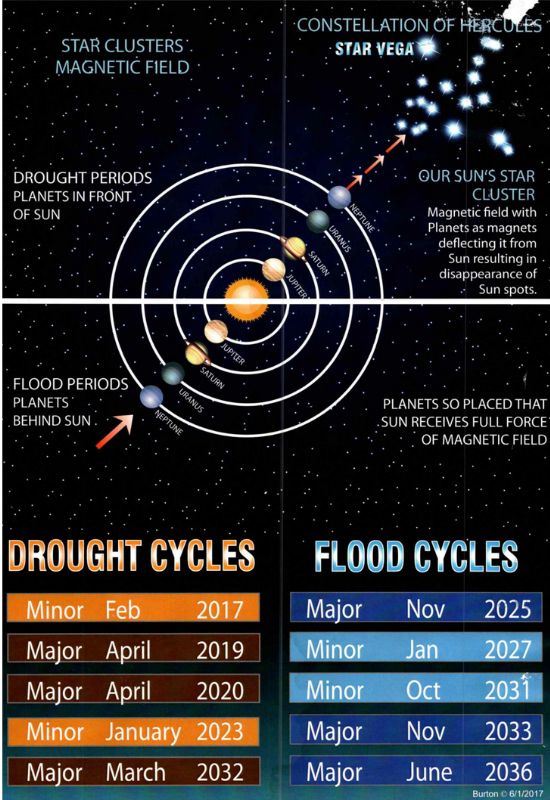
Inigo Owen Jones methods are based on long term weather forecasting using sunspot cycles and astronomy to predict floods and droughts.


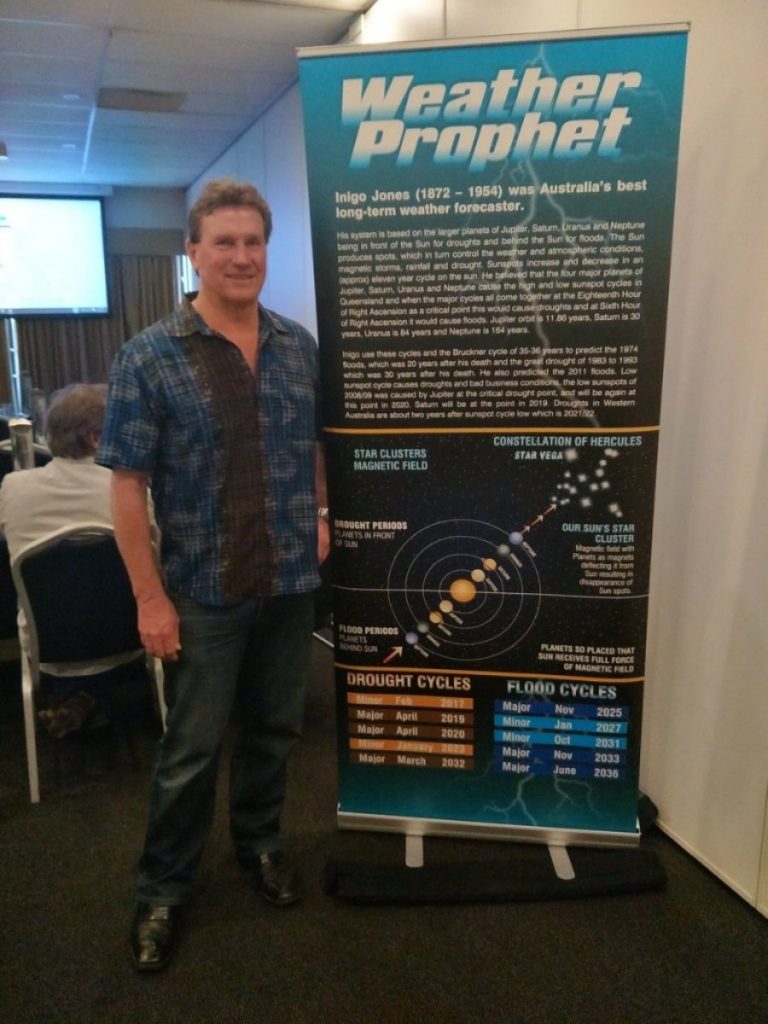
Stock & Commodity Trader
Long term weather forecaster

Learn the fundamentals of sunspots and cycles.
Learn new ways to manage your farm business.
Need a business strategy? Harness the power of cycles to make better business decisions.
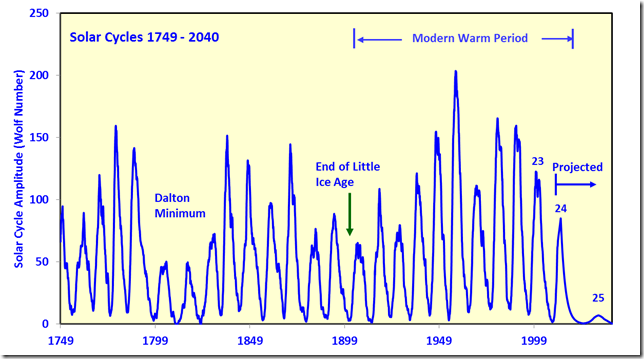
Cycle 25 is due to peak around mid 2025 between 75 and 120. Sunspots and planetary cycles are what I use to forecast the weather. You can’t do it with computer models and this is why NASA, IPCC, BOM are always nearly 100% wrong 100% of the time. They will never be able to forecast 100 years in advance, with astronomy, you can forecast 1000s of years in advance if you know the secret vibrations to planetary movements.
There’s a reason why W.D. Gann and Inigo Jones went back to studying 1000s of years of data. It was to study cycles in commodities back all the way to 1259 A.D and for sunspots/weather cycles back to 800 B.C to get the long-term trends and that’s why you need to have long term data. The main driver of weather (not the environment) is the sun and the planetary cycles working their vibrations in “Inverse square law”. The longer-term cycles are the precession of the equinoxes and movement around the “Barycentre”. Most people who dribble on about global warming really mean the damage to the environment (they don’t know the difference between weather and the environment), this is caused naturally by storms, droughts and floods etc. but the biggest damage is from human behaviour. To fix the environment you have to have less demand for man-made products, so you need fewer humans ( maybe one-child policy), but this will cause a collapse in many businesses as we would go into recession or depression.
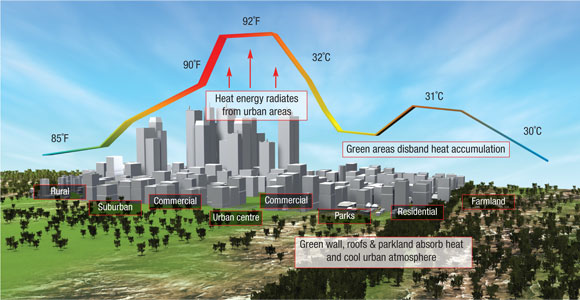
All cities are 3 to 6 degrees hotter, created by what’s called “Urban heat island”. Of course, all weather stations that were once under trees in the shade are now at airports and in cities. The cities have electricity under the road which generates a lot of heat, traffic, glass buildings and tarmac which is black. This heat is only localised and has nothing to do with changing the weather. Of course, this only shows in the summer time not winter as places like New York, London, Moscow and Chicago have had record cold and snow over the last 3 years. People think cutting down trees is causing global warming, but they can’t explain why there are no trees on the poles and why it has less than 100 mils of rain a year or why Birdsville has 140 people and in constant drought and Sydney has 4 million people and it has 1500 mils of rainfall a year.
On top of all this, governments around the world have been deleting and fudging figures to push their global warming agenda. The BOM deleted the hottest day temperature ever recorded from 125f to 112f. Go to https://jennifermarohasy.com/ for details. Another great historical site for weather research in Australia is https://joannenova.com.au. We have all government weather departments around the world fudging and deleting all figures from NASA, IPCC, BOM and CSIRO. There’s a reason for this because they want to make the present hotter and drier and the only way you can do this is by deleting and fudging the past to scare the hell out of everyone. These people called “EVER” only 20 years ago, what a joke! There have been millions of famines, droughts, frosts, floods etc. https://en.wikipedia.org/wiki/List_of_famines.
We have had a 1500 year drought in Australia, https://www.news.com.au/national/study-suggests-1500-year-long-mega-drought-killed-off-original-australians/news-story/125f5ee0fed2295bc7f2453624f08ca8
We have had 23 and 39 -year droughts in the last 500 and 1000 years. http://acecrc.org.au/news/antarctic-ice-core-study-reveals-australias-39-year-mega-drought/
There’s no government talking about the long-term history of weather and climate because it would be too honest. There’s also a book you can buy called “Famines of the world: Past and Present” by Cornelius Walford. This data starts at around 1708 B.C, and there are 100s of floods, droughts, famines, frosts etc. in the book. The Australian data goes back to 1789, just after the settlement.
1789 – Dry, 1812 – world drought, 1833 – big drought, 1838/39 – great drought, 1842 – very dry, 1844 – very wet, 1849 – record low rainfall, 1850 – drought of Lachlan, 1852 – break in drought, flood at Gundagai, 1862 – a dry year, 1866 – very dry inland, 1868 – a dry year, 1870 – a year of floods, 1888- a great drought, 1890 – Record floods in Australia, 1901-02 – the great drought of 1902,
1914 – very dry year in the south, 1918-19 – drought, 1920-21 – floods, 1922-23 – drought, 1935-36 – drought, 1940 – drought & 1944 both severe droughts, 1949 & 1950 destructive flood years.
Clearly, the BOM has all this data but chooses only to use data from 1910 so they can mislead you and miss all these dry years prior because the dry times were way worse before 1910. Like their models, they cherry-pick the data period when they need to make a point. They use the period from 1961 to 1990 most of the time, why not from 1800 to 2020? Their weather stations are moved or closed down so they don’t have the same length of data which is another flaw. Their computers make the temperatures hotter than the raw data. They use models called Acorn 1 that are 53% better than the raw data, Acorn 2 is 23% hotter than Acorn 1 making a total of 65% hotter than the raw data. This means you have to deduct 45% off current temperature’s to get back to the raw data.
The rising sea levels? The ocean doesn’t move, the land moves called Earth tides. The moon pulls the earth up and the tide goes out and vice versa.
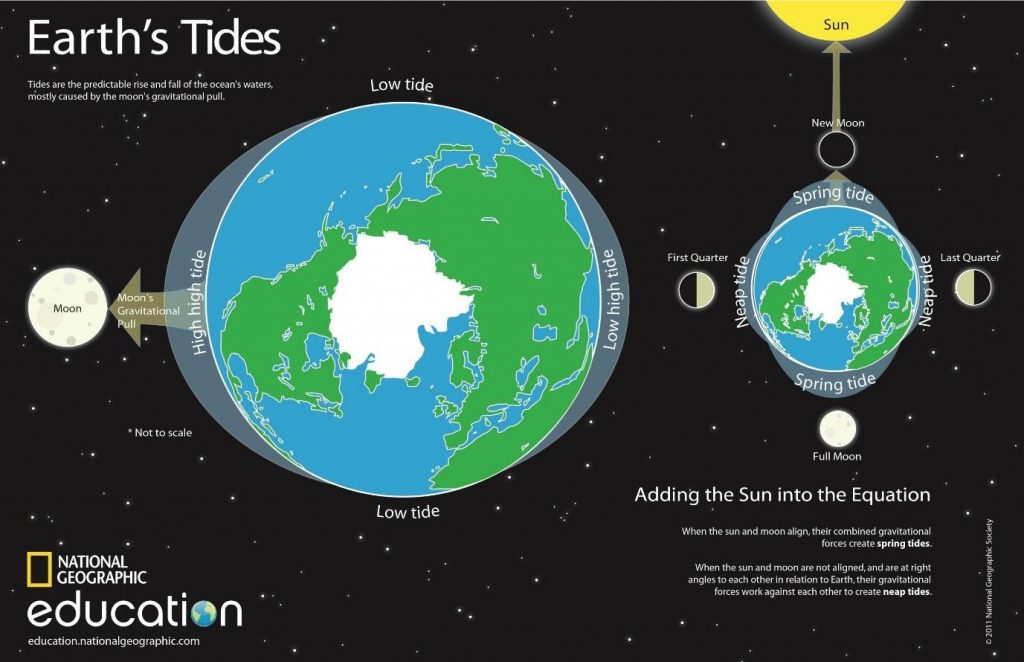
The moon and sun make up the 29-day cycle, but there are many cycles of the moon and sun and you would have to measure the exact event at the exact time to measure the ocean correctly, then you have all the other planets in a different position as well. Here’s just a small 19 year cycle, but there is an eclipse cycle of 649 years and the exact moon/sun cycle is 1040 years. https://en.wikipedia.org/wiki/Metonic_cycle
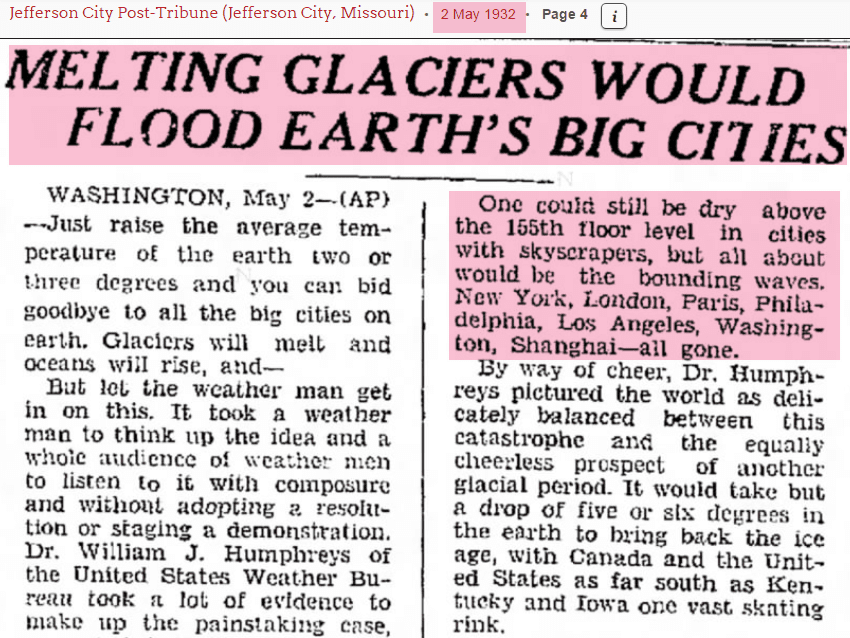
There have been many ice ages and the current one could last as long as the one from 1645 to 1715 which means this one we are about to enter would last to 2080. Ice ages are caused by low sunspots which average 11.2 years, which is very close to Gann’s 1/32th of a circle of 11.25. Everything is part of 360. 360 is time in the bible, time, times and half time is 1260 years. Add the moon/sun cycle of 1040 years you get another bible cycle number of 2300 years. A good program to watch that keeps you up with all the cold and snow records is Rowan Dean’s “Ice Age Watch” on Sky News on Sundays. The poles will be melting for 100s of years according to scientists in 1932, suggesting being on the 155th floor of skyscrapers around the world, was the safest level. What fools believe this nonsense!!
There are 100s of cities under the ocean going back 1000s of years. https://earthnworld.com/10-mysterious-underwater-cities-of-the-ancient-world/
Tim Tam Flannery who got $90 million in grants and lives by the river. He made many predictions that were 100% wrong. https://www.riteon.org.au/tim-flannery-professor-of-dud-predictions-and-climate-falsehoods/
Kevin Rudd, Al Gore, Obama, Julia Gillard, Malcolm Turnbull all have houses by the ocean so clearly, they preach one thing and do another. They don’t believe the oceans are rising. Here are 140 years of zero rise in the sea levels in Sydney.
https://factcheck.aap.com.au/social-media-claims/fort-denison-pics-no-indicator-of-sea-level-rise
Getting back to NASA, IPCC, BOM, scientists and meteorologist’s around the world, none of them can predict the weather. They say they have these million-dollar highly intelligent computers that can forecast 100 years in advance and be 100% accurate, what garbage…..!!!!, They can’t forecast the weather accurately 100 days or 100 hours forward. For example in 2018 NASA forecast a continuing warm and mild winters for the USA, we have had nothing but cold and snow records smashed every year. BOM was predicting La Nina in 2018 and we had the biggest drought in Eastern Australia in 200 years. They recently forecasted a wet spring and summer with rainfall to be 60% above average across the whole country. We have been 50 to 70% down on average. On my Facebook page I posted in August 2020 that we would have no La Nina and very few cyclones. I also posted that flooding would happen in Brisbane around 14th December 2020, 4 months in advance. Back in 2009 I wrote about low sunspots/drought and the collapse in the economy for this period from 2018 to 2021 in “Your Trading Edge” magazine. They have pumped money all the round the world but costs of living will rise and many countries will end up like Venezuela.
You can get all my back issues of “Your Trading Edge” with a three year subscription from 2003 to now, some 80 articles on W.D.Gann and Inigo Jones covering horse racing, sunspots, astro-meteorology, ancient geometry, stock market cycles, tunnel thru the air codes etc.
ALL WEATHER IS NORMAL, ALWAYS HAS BEEN AND ALWAYS WILL BE!!!
THERE’S NO SUCH THING AS EXTREME WEATHER, YOU JUST HAVEN’T GONE BACK FAR ENOUGH IN HISTORY.
If you believe in global warming other than natural cycles, you believe in Santa Claus.
David has been using and studying Gann for nearly 40 years.
One of Gann’s most incredible predictions took place in 1928 when Gann predicted the end of the great bull market in stocks for September 3, 1929, and the greatest panic to follow.
Website designed by Regional Roar Digital Marketing